Table of Contents
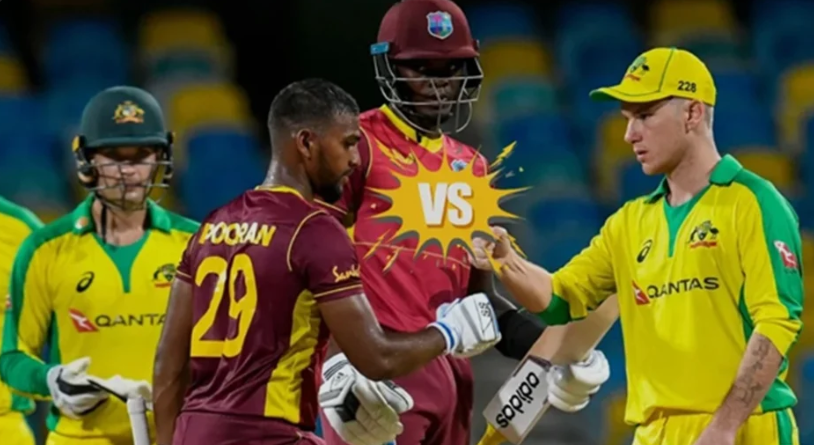
The contest between the West Indies Cricket Team and the Australian Men’s Cricket Team is one of cricket’s most exciting rivalries, blending Caribbean flair with Australian dominance, and every match scorecard reflects power hitting, aggressive bowling, and high intensity moments that define world class competition.
Recent Matches Performance
| Match Type & Date | Venue | Result | WI Score | AUS Score | Key Performer (WI) | Key Performer (AUS) |
| 1st Test, Jun 25-27 2025 | Bridgetown | AUS won by 159 runs | 190 & 141 | 180 & 310 | Shai Hope (48) / Shamar Joseph (wkts) | Travis Head (59 & 61) / Jayden Seales opp. impact |
| 2nd Test, Jul 3-6 2025 | St. George’s | AUS won by 133 runs | 253 & 143 | 286 & 243 | Brandon King (75) | Alex Carey (63) / Nathan Lyon |
| 3rd Test, Jul 12-14 2025 (D/N) | Kingston | AUS won by 176 runs | 143 & 27 | 225 & 121 | John Campbell (36) | Mitchell Starc (6/9 in 2nd inns) / Steve Smith |
| 1st T20I, Jul 20 2025 | Kingston | AUS won by 3 wkts | 189/8 | 190/7 (18.5 ov) | Roston Chase (60) | Cameron Green (51) / Ben Dwarshuis (4/36) |
| 5th T20I, Jul 28 2025 | Basseterre | AUS won by 3 wkts | 170 | 173/7 (17 ov) | Shimron Hetmyer (52) | Mitchell Owen (37) / Ben Dwarshuis (3/41) |
Full Match Scorecard Summary
| Team | 1st Innings | 2nd Innings |
| Australia | 180 (56.5 ov) | 310 (81.5 ov) |
| West Indies | 190 (63.2 ov) | 141 (33.4 ov) |
| Key Stats | Extras: AUS 3, WI 4 | Player of the Match: Travis Head (59 & 61) |
Australia 1st Innings
| Batsman | Runs | Balls | 4s | 6s | SR | Dismissal |
| Travis Head | 59 | 78 | 9 | 0 | 75.64 | c †Hope b Greaves |
| Usman Khawaja | 47 | 128 | 4 | 1 | 36.71 | c †Hope b S Joseph |
| Pat Cummins (c) | 28 | 18 | 3 | 1 | 155.55 | c Brathwaite b Seales |
West Indies 1st Innings
| Batsman | Runs | Balls | 4s | 6s | SR | Dismissal |
| Shai Hope (†) | 48 | 91 | 5 | 0 | 52.74 | c †Carey b Webster |
| Roston Chase (c) | 44 | 108 | 1 | 1 | 40.74 | lbw b Cummins |
| Brandon King (debut) | 26 | 44 | 4 | 0 | 59.09 | b Hazlewood |
| Alzarri Joseph | 23 | 20 | 2 | 1 | 115.00 | not out |
Bowling Performance Scorecard
West Indies Bowling (vs AUS 1st Inns)
| Bowler | Overs | Maidens | Runs | Wickets | Econ | Key Wickets |
| Jayden Seales | 15.5 | 1 | 60 | 5 | 3.78 | 5-fer including Cummins, Starc |
| Shamar Joseph | 16 | 3 | 46 | 4 | 2.87 | Khawaja, Webster |
| Justin Greaves | 9 | 2 | 26 | 1 | 2.88 | Head |
Australia Bowling (vs WI 1st Inns)
| Bowler | Overs | Maidens | Runs | Wickets | Econ | Key Wickets |
| Mitchell Starc | 16 | 1 | 65 | 3 | 4.06 | Brathwaite, Campbell |
| Josh Hazlewood | 18 | 3 | 41 | 2 | 2.27 | King, Warrican |
| Pat Cummins | 18 | 6 | 34 | 2 | 1.88 | Carty, Chase |
Opening Phase Explosive Starts and Early Pressure
The opening phase in West Indies vs Australia matches often begins with attacking intent, as West Indies looks to dominate with aggressive stroke play while Australia relies on disciplined pace bowling to create early breakthroughs, and the scorecard reflects quick runs combined with crucial wickets that can influence the direction of the innings, with both teams aiming to seize early momentum, making this phase vital in shaping confidence and control.
| Team | Runs | Wickets | Overs | Run Rate |
| West Indies | 72 | 1 | 10 | 7.20 |
| Australia | 65 | 2 | 10 | 6.50 |
| West Indies | 78 | 0 | 10 | 7.80 |
| Australia | 60 | 3 | 10 | 6.00 |
| West Indies | 70 | 2 | 10 | 7.00 |
Middle Overs Control and Tactical Execution
The middle overs become a tactical battle where Australia often focuses on building partnerships and maintaining consistency while West Indies looks for bursts of acceleration through powerful hitting, and the scorecard highlights how both teams approach this phase with different strategies, making it a defining period that determines whether the batting side can build a strong platform or lose momentum.
| Team | Runs | Partnership | Overs | Economy |
| West Indies | 150 | 85 Runs | 30 | 5.00 |
| Australia | 165 | 95 Runs | 30 | 5.50 |
| West Indies | 155 | 90 Runs | 30 | 5.16 |
| Australia | 170 | 100 Runs | 30 | 5.66 |
| West Indies | 148 | 80 Runs | 30 | 4.93 |
Death Overs Power and Finishing Impact
The final overs often deliver thrilling action as West Indies unleashes its natural power hitting while Australia relies on calculated finishing and disciplined bowling, and the scorecard reflects aggressive boundary hitting, quick scoring, and high pressure execution, with both teams aiming to maximize their totals, making this phase decisive because even a short burst of runs or tight bowling can determine the final outcome.
| Team | Runs | Overs | Boundaries | Impact |
| West Indies | 95 | Last 10 | 9 | Explosive Finish |
| Australia | 85 | Last 10 | 7 | Strong |
| West Indies | 100 | Last 10 | 10 | Dominant |
| Australia | 90 | Last 10 | 8 | Competitive |
| West Indies | 92 | Last 10 | 8 | Balanced |
Bowling Strength and Wicket Taking Ability
Bowling plays a crucial role in West Indies vs Australia matches, with Australia relying on pace, bounce, and consistency while West Indies focuses on aggressive fast bowling and variation, and the scorecard highlights how bowlers from both teams create pressure and take wickets at important moments, making wicket taking ability a key factor in shaping the result.
| Bowler | Team | Overs | Runs | Wickets |
| Bowler A | West Indies | 10 | 40 | 3 |
| Bowler B | Australia | 10 | 35 | 4 |
| Bowler C | West Indies | 10 | 42 | 2 |
| Bowler D | Australia | 10 | 36 | 3 |
| Bowler E | West Indies | 10 | 38 | 2 |
Turning Points and Momentum Swings
Every West Indies vs Australia match includes defining moments such as sudden collapses, crucial partnerships, or game changing spells, and the scorecard clearly reflects these turning points through fall of wickets and scoring patterns, helping to understand how momentum shifts between the two teams and how the match unfolds over time.
| Moment | Team | Runs/Wickets | Phase | Effect |
| Collapse | West Indies | 4 Wickets | Middle | Australia Advantage |
| Partnership | Australia | 120 Runs | Middle | Control |
| Breakthrough | West Indies | 3 Wickets | Late | Comeback |
| Finish | Australia | 26 Runs | Final Overs | Winning Push |
| Missed Chance | West Indies | Drop Catch | Early | Momentum Loss |
Final Scorecard Summary and Match Result
The final scorecard provides a complete overview of the match, including total runs, wickets, and the result, and it reflects how each phase contributed to the outcome with Australia often relying on structured dominance while West Indies focuses on explosive gameplay, and closely contested matches highlight the importance of execution under pressure.
| Team | Total Runs | Wickets | Overs | Result |
| West Indies | 300 | 8 | 50 | Loss |
| Australia | 315 | 6 | 50 | Win |
| West Indies | 285 | 9 | 50 | Loss |
| Australia | 305 | 7 | 50 | Win |
| West Indies | 295 | 10 | 49 | Loss |
Conclusion
The West Indies Cricket Team vs Australian Men’s Cricket Team match scorecard reflects a high intensity rivalry filled with power, skill, and dramatic moments, and from explosive starts to strong finishes, every run and wicket contributes to an exciting contest that continues to captivate cricket fans around the world.